
Tracking Management System
@Shopee, 2021
What is Tracking?
Tracker is a bunch of code integrated into Front End/BE. Once users triggered certain events (e.g. click something or view a new page), event handler methods are called, then we can collect the data to know users' behaviors with our products.

What is TMS?
TMS ( Tracking Management System) is a centralized platform for users to create, test, monitor, and control their tracking data.

What's Wrong with Our Tracking System?
The existing version was built by the development team several years ago without the designer's help. Over years we received many complains about this system, including:
- Current scheme is hard to cover all position info as the App structure gets complex.
- The creation and management flow is confusing and low in efficiency;
- Tracking data is hard to understand, and cannot be used by others except the one who created it;
- FE/BE: location and content info is scattered in the data field, makes it impossible to do full stock analysis in the user's life cycle
Redesign goals
For BI & Feature PM (user)
- Simplify the creation and management flow to raise working efficiency;
- Clear guidance in tracking data structure;
For Data Team (owner)
- Universal tracking data structure;
- Improve the usability of the system, so that the tracking data can serve a wider group of users.
Step 1: Clarify goals & functional hypothesis
In the first step, I talked with a data PM to get background and basic information, as well as a rough idea of what we are going to do. Usually for all my design projects, I would like to get the following information from our first meeting with PMs:
- Target user and their tasks;
- Current user flow;
- Issues we solve and values we bring;
- Product abilities update;
- Expected results;
In this project, we are focusing on updating one core product ability for TMS: the location data structure. While the approach to changing the data structure is not yet fully confirmed by the data PMs, we aim to verify its feasibility through user research and remain open to alternative solutions.
-
Page_Type
-
Page_Section
-
Target_Type
-
A_Site: Business domain units
-
B_Page: Product line pages
-
C_Block: Page sections up to 5 layers
-
D_Point: Atomic units

To ensure smooth collaboration, we have defined our responsibilities and cooperation methods. My partner, a former engineer transitioning to a PM role, will primarily handle the data structure design, resource allocation, and communication with other stakeholders. Meanwhile, I'm going to designing the workflows and ensuring usability.
Step 2: Figure Out real User Needs Through Contextual Inquiry
To limit the length of this article, I'll just narrow down the narrative scope to Creation & Management flow, whose main users are FPM & BI & Data PM.
In this step, my focus was on gaining clarity regarding user intentions and task details by engaging with the target user groups. Additionally, I aimed to find answers to the questions that arose in Step 1.
I invited the data PM and FE dev to participate in several observation sessions. This allowed us to address a broader range of potential issues. We got a long observation record and some key insights here:
1.Varied Tasks for Different Roles:
- FPMs: as the business owners with a deep understanding of the content, are primarily responsible for creating position information.
- BI & PA: handle extensive analysis work and are responsible for designing high-quality tracking events for SQL queries that can be reused across features. Batch editing is particularly important for them.
- Data PM: Approve/reject new tracking requests; and they are the sole role in defining new operations.
2. Different Frequencies of Data Point Updates:
- Registering new positions is relatively rare. People don't Usually change the Page_level & Section_level info;
- Most of the tracking updates occur at the Target_level, involving frequent modifications to specific data fields.
3. Necessity of Migration for All Business Groups:
-
All teams rely heavily on existing tracking data and will continue to do so.
-
However, there is a consensus among teams that there are numerous abandoned or outdated trackings within the system that are challenging to identify and remove.
I also got answers for my previous questions:
1. Why not define a standard position structure at least within product line?
- Actually, some business lines did standardize their own position structure, although might not in the way defined by data team;
- Current scheme can't cover all position info, so users have to figure out their own way;
- We don't provide any guidance or reference in TMS;
2. How do they do cross-page traffic analysis?
- PMs use the Pages function from TIDAL, but it's hard to find all tracking points, so basically just page traffic. For point level analysis they always need to ask BI to write SQL query to get all data.
Step 3: Map out user journey, reveal pain points and generate solutions
After obtaining the necessary task details, we proceeded to organize the behavior for each role in a step-by-step manner. During this process, we identified the pain points experienced by users and delved into the underlying reasons behind them, brainstormed potential solutions to address these pain points:


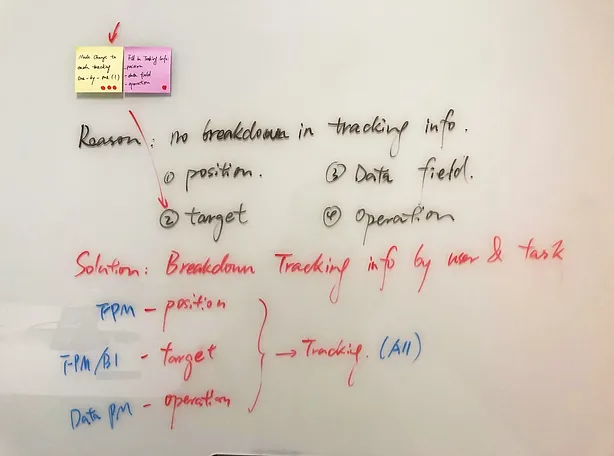

During our discussions, the ideas surrounding the page structure and features for the new TMS began to take shape.
We made some changes to the tracking data structure so that the concept becomes more straightforward for ordinary user. This new structure allows for the efficient management of tasks by different roles within the system.
-
A_Site: Business domain units
-
B_Page: Product line pages
-
C_Block: Page sections up to 5 layers
-
D_Point: Atomic units
- / A_Site: Business domain units
-
B_Page: Product line pages
-
C_Block: Page sections up to 5 layers
-
D_Point: Atomic units
-
Target: Tracking object

We finalized product features, and also shared initial prototype for key UX (e.g: position table view) so that she can conduct feasibility study with devs at a very early stage.
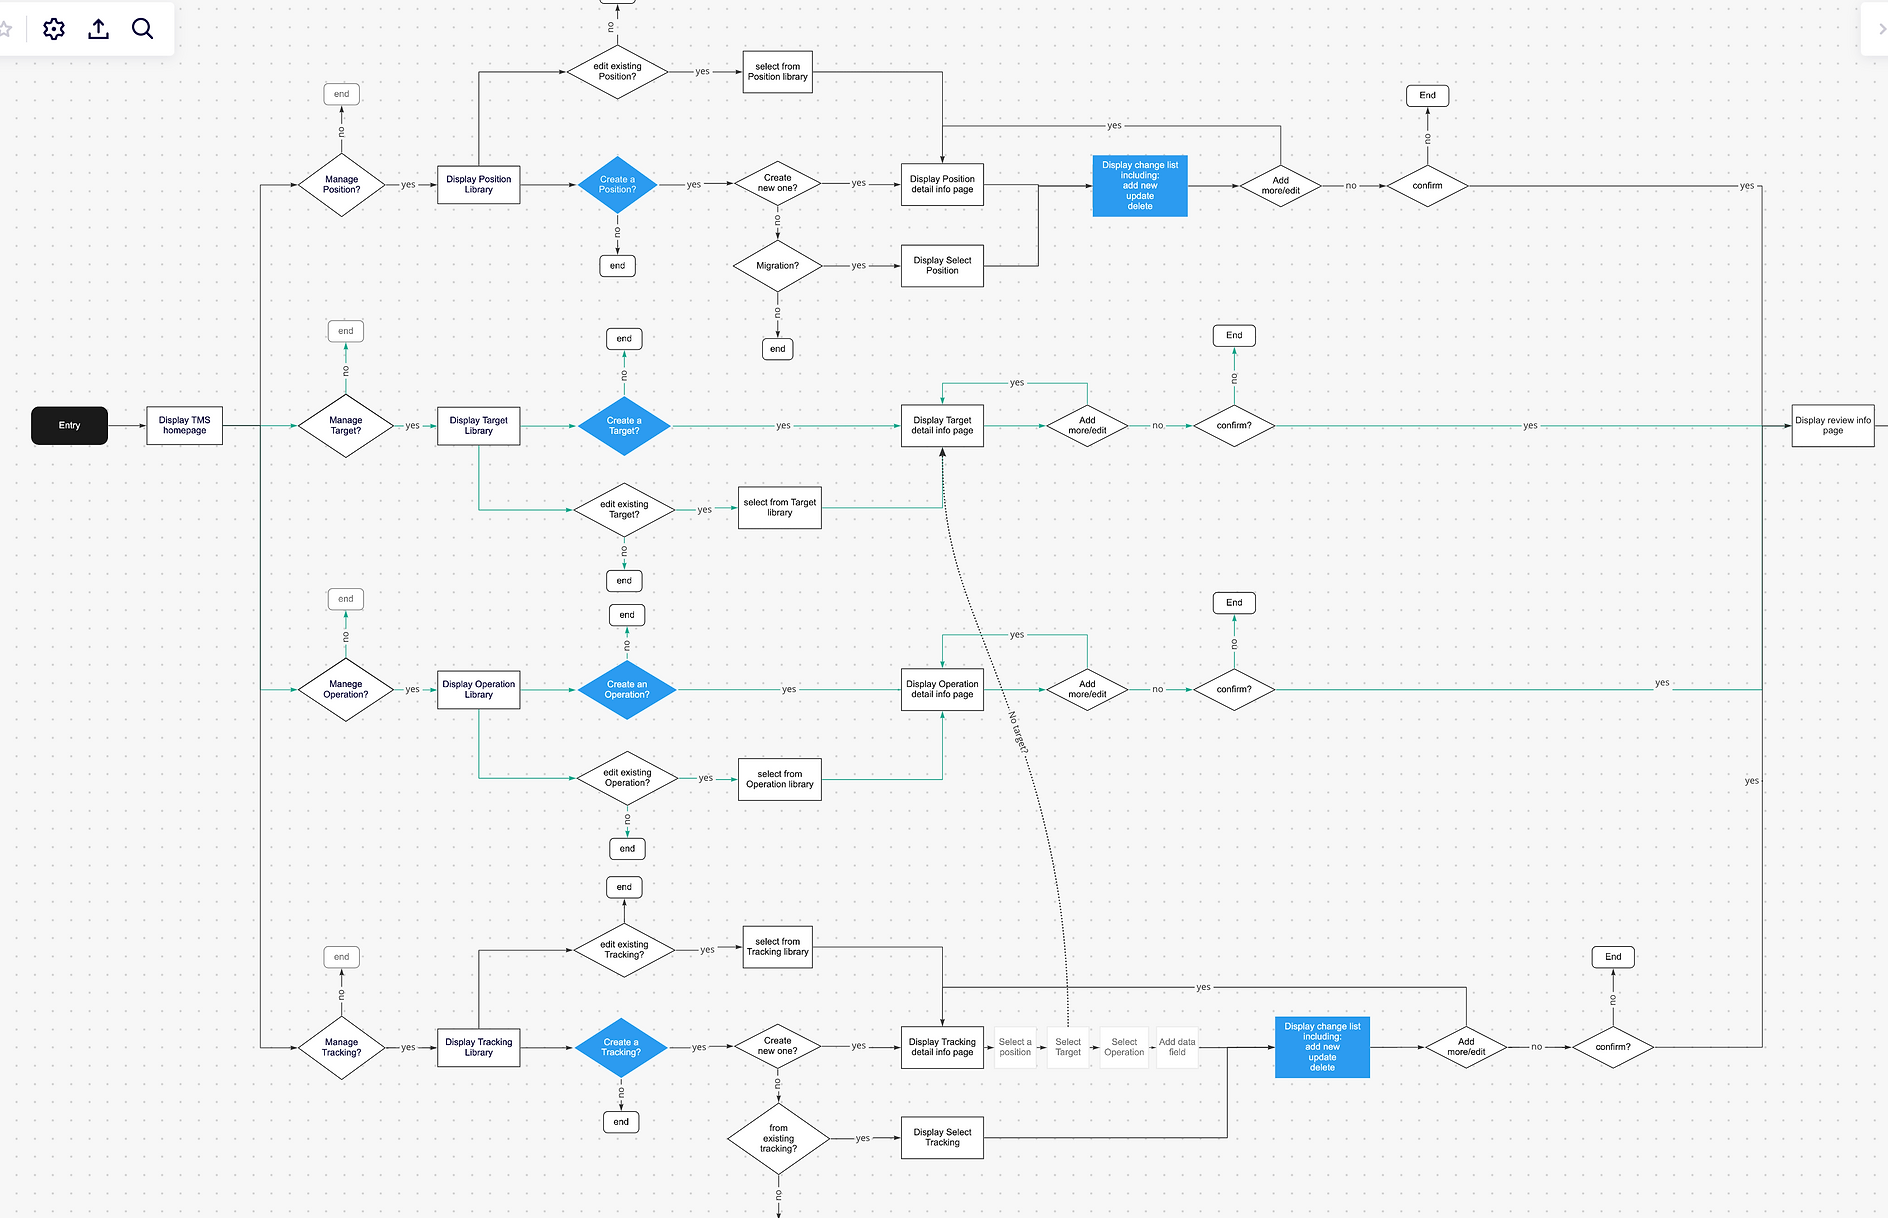
Step 4 Finalize Workflow
According to the adjusted product function and data format, we divide the whole tracking assets management module into four parts.
This division allows us to cater to the specific operational needs of different users who have varying tasks and frequencies. By tailoring each part to accommodate the unique requirements of different user groups, we aim to optimize the overall user experience and improve efficiency in managing tracking assets.
1. Position Library ( FPM; rarely use)
- B_page: the page info
- C_section: page section info. Can have no more than 3 layers
- D_point: The atomic unit that users interact with
2. Target Library ( FPM & BI; frequently use)
- E_Target: the target that can be placed at any position, it can be a single object or a group of objects. e.g. item card, YMAL, banner, link.
3. Operation Library ( Data PM; seldom use)
- Operation is a set of predefined user behaviour.e.g. impression, click, add to cart.
4. Tracking Library ( All; frequently use)
- A combination of position, target and operation.
Step 5 Low-to-High fidelity prototype
In the final step, I transitioned low-fidelity sketch to high-fidelity design files that are ready for development by utilizing Shopee enterprise design system.

For the newly introduced UX( Map View for example), I took the responsibility of building the component from scratch, ensuring it aligned with our design principles and met the needs of our users. After polishing the component, we integrated it into our existing design system.


Full Prototype in Figma.
After the revamp, our product owners and developers started to construct an accurate traffic data map cross product lines, a wider range of users are now able to comprehend and utilize our traffic data in their day-to-day work, leading to improved data-driven decision-making and enhanced productivity across the organization.
If you are interested in TMS, we can talk about:
- Debug View: A real-time simulation tool for developers to debug newly built tracker.
- Live View: A library that accesses users' real-time operational data for analysis.
- TMS Monitor: A data dashboard helps tracking owners to monitor alert and generate insight.